Result
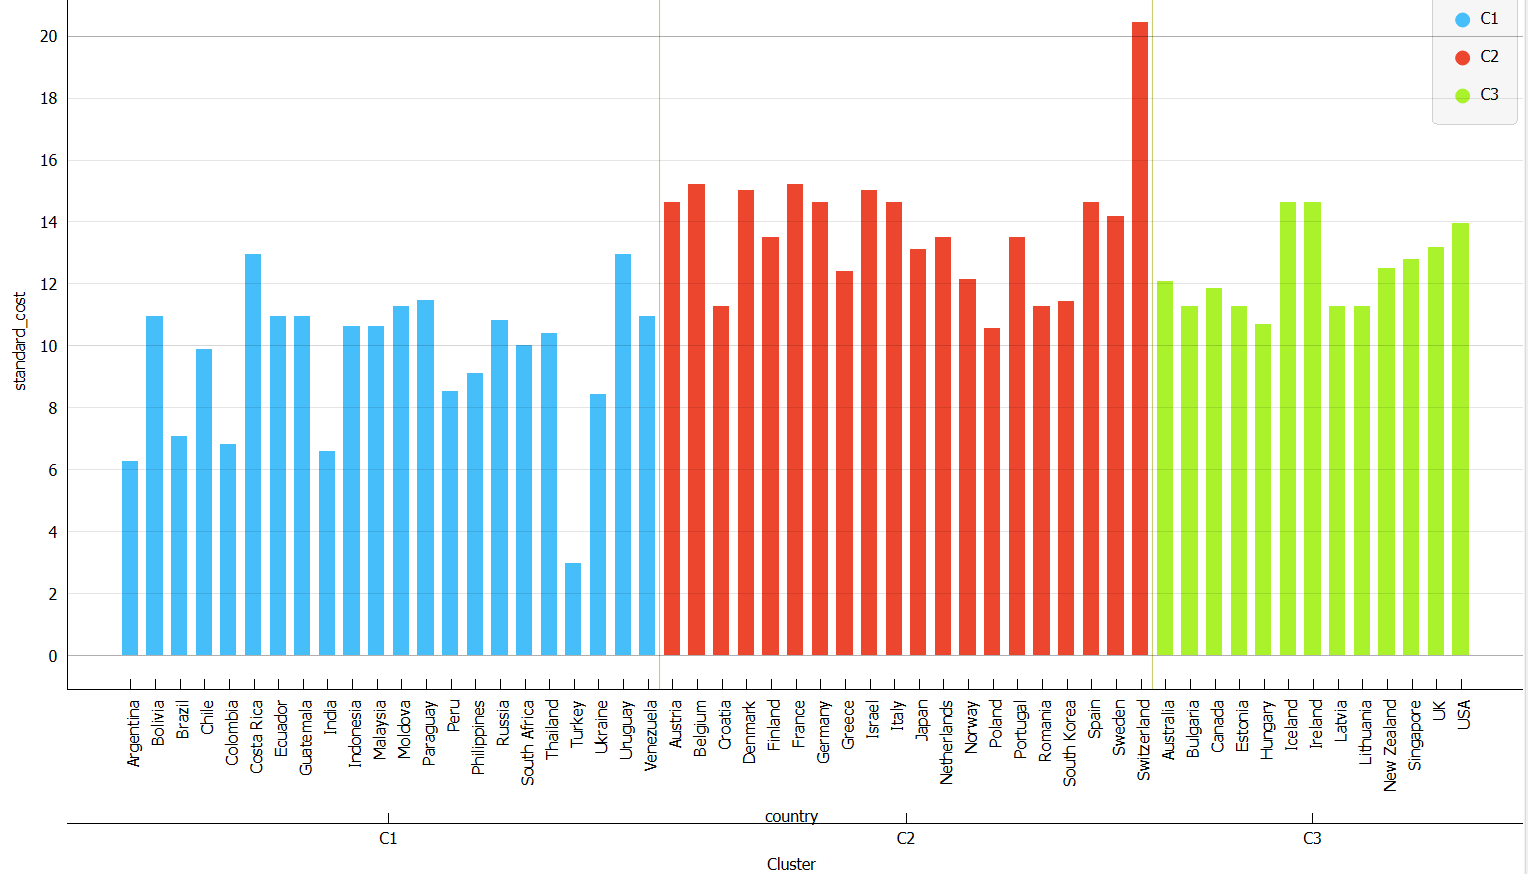
The box plot shows separability of standard netflix subscription price between three clusters of countries (c1, c2 and c3). Mean value for c2 is pretty different than c1 and there is some difference with c3 as well.
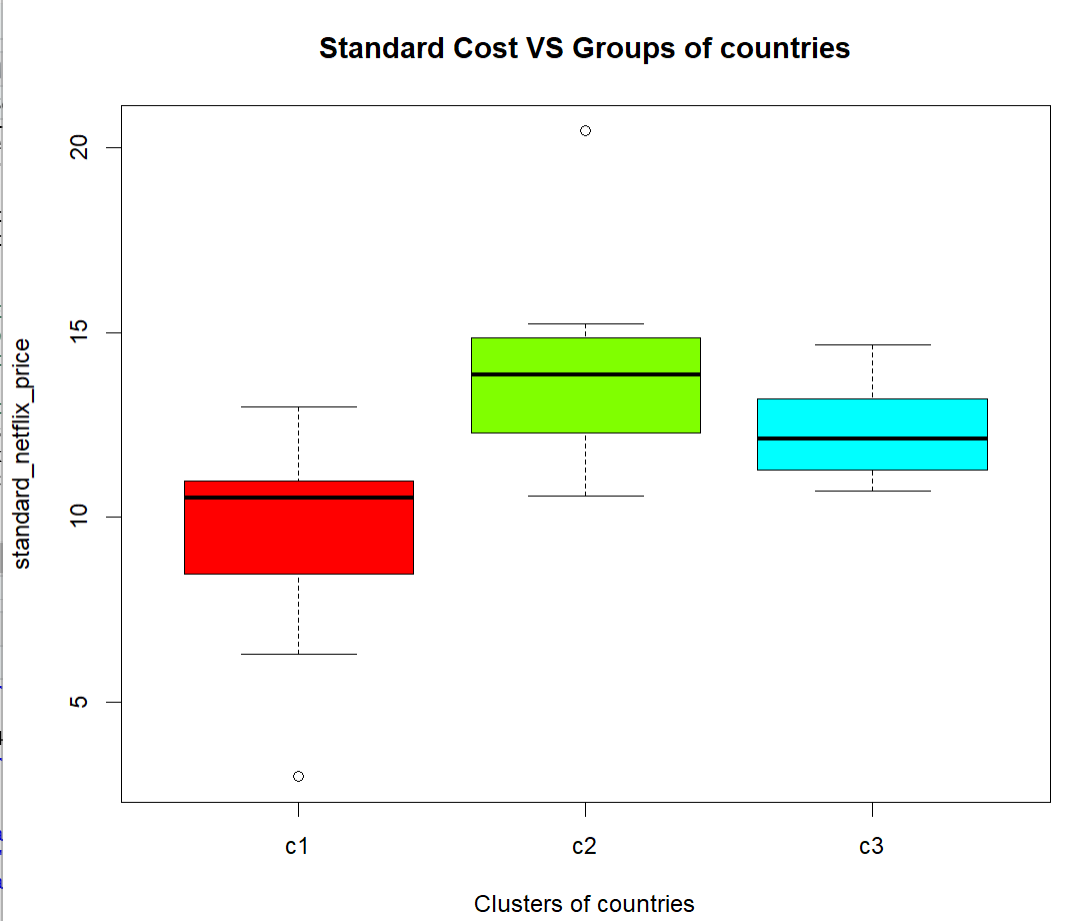
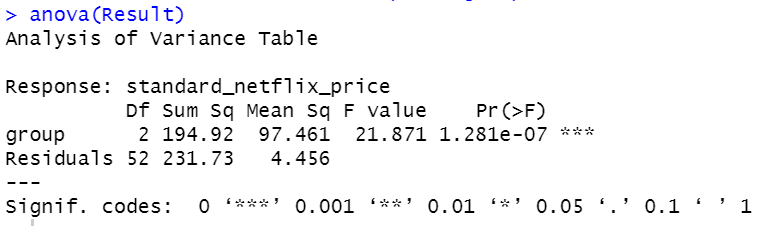
Anova test showed there is significant difference in standard price for different clusters of countries. We got p value of 1.281e-07 which is super low (significance level 0.05) showing there is a significant difference in values of standard netflix price for different clusters of countries.
We used regression model to identify the relationship between income of a country and Netflix standard subscription price and number of subscribers for different countries across the world. Below is the summary of the results from the regression model for income and standard cost.
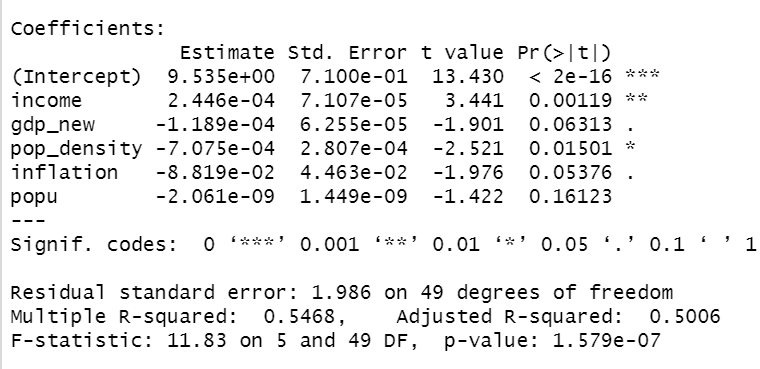
In the figure above we can see we got a p value of 1.579e -7. We got this result while controlling for the country's gdp, population, population density and inflation. The lower p value shows that average income of a country affects netflix standard subscription price in a significant way. However, the R squared value of 0.5 shows there is not strong correlation between Income and standard Netflix subscription price.
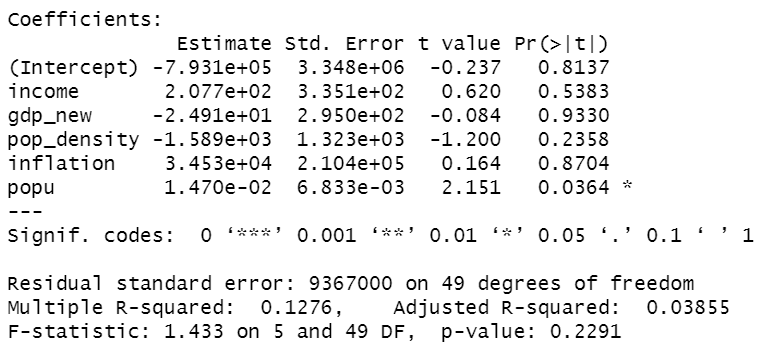
In the figure above we can see we got a p value of 0.2291 We got this result while controlling for the country's gdp, population, population density and inflation. The p value shows that average income of a country doesn't affect netflix subscribers in a significant way. Also, the R squared value of 0.03855 shows there is not much correlation between Income and Netflix subscribers.
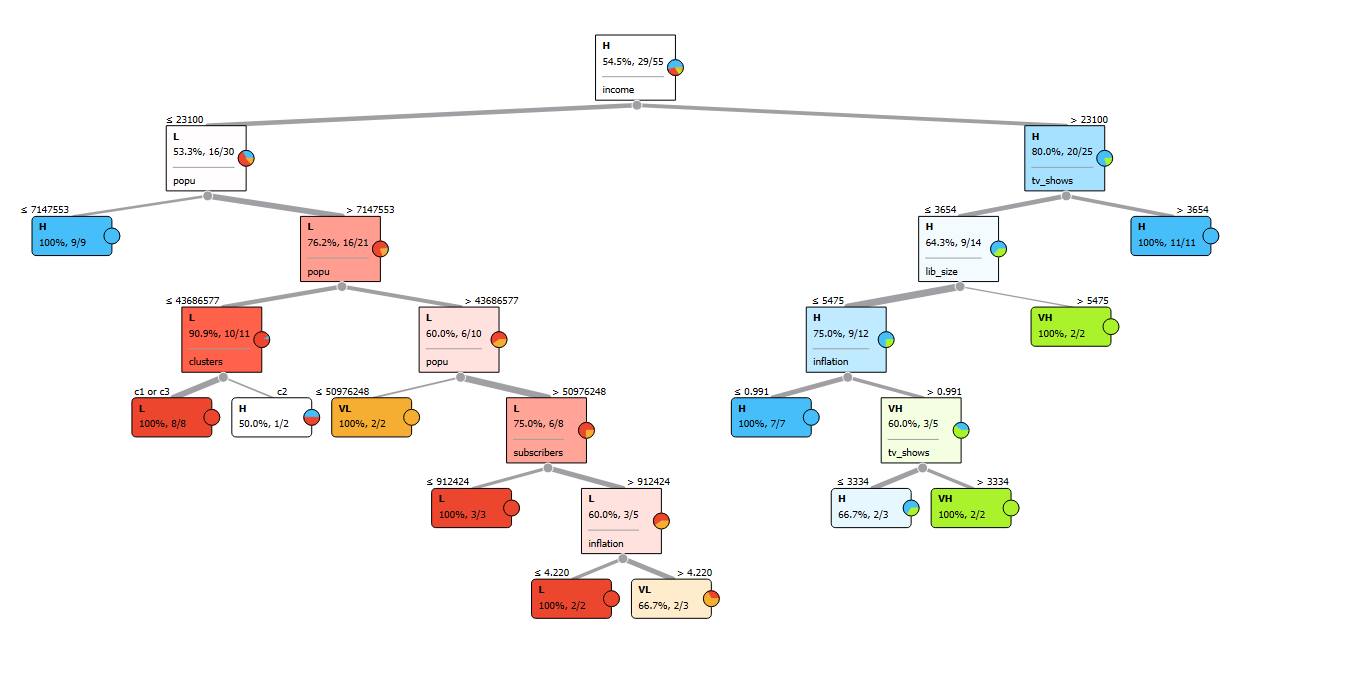
From the figure we can see that a tree of depth 7 can perfectly classify four categories of standard Netflix subscription price (Very Low, Low, High and Vey High). Furthermore, "Income" variable in the root level shows it has highest gain. We can get various useful insights from this diagram like, if income is greater than 23100 and population is greater that 7147553, then that country belongs to "High" standard subscription price category.
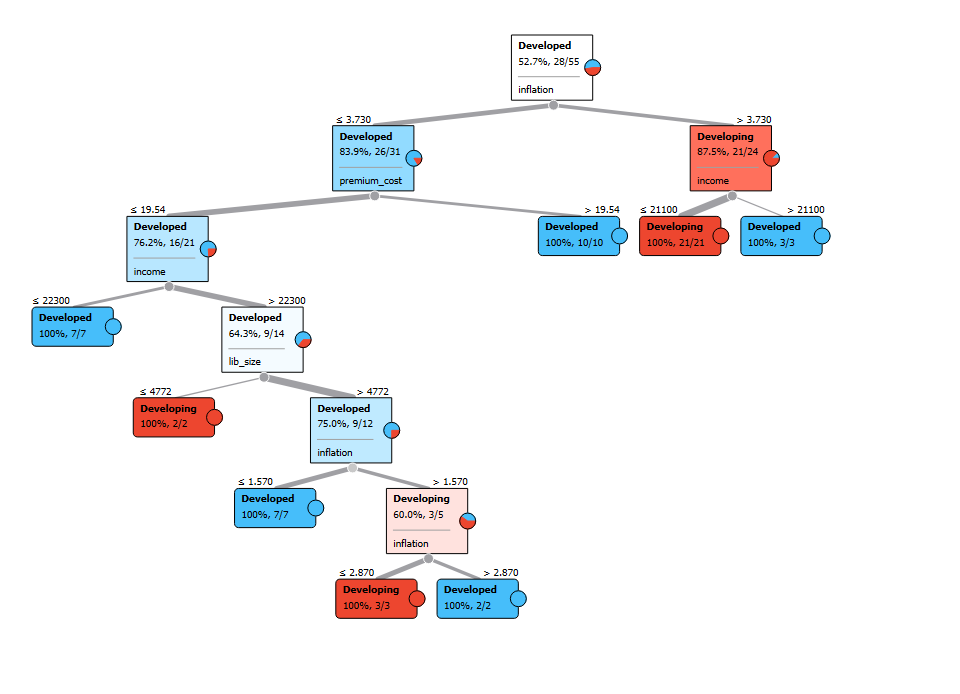
From the figure we can see that a tree of depth 7 can perfectly classify countries as developing or developed. Furthermore, "Inflation" variable in the root level shows it has highest gain. We can get various useful insights from this diagram like, if inflation is greater than 3.730 and premium cost is less than 19.54, then that country belongs to "Developed" category.